Enterprise Performance Management Dashboard
Data dashboard for measuring and managing the performance of the business from superintendent to the COO level all supported by a centralized repository of business metrics.
My Roles
UX Designer
UI Designer
Visual Designer
Team
Product Owner
Product Manager
PowerBI Developers
Full-Stack Developer
UI/UX Designer
Tools
Illustrator
Adobe XD
PowerBi
Microsoft Office
Company Overview
Vale S.A. is a Brazilian multinational corporation engaged in metals and mining and one of the largest logistics operators in Brazil. Also, the largest producer of iron ore and nickel in the world.
OVERVIEW –
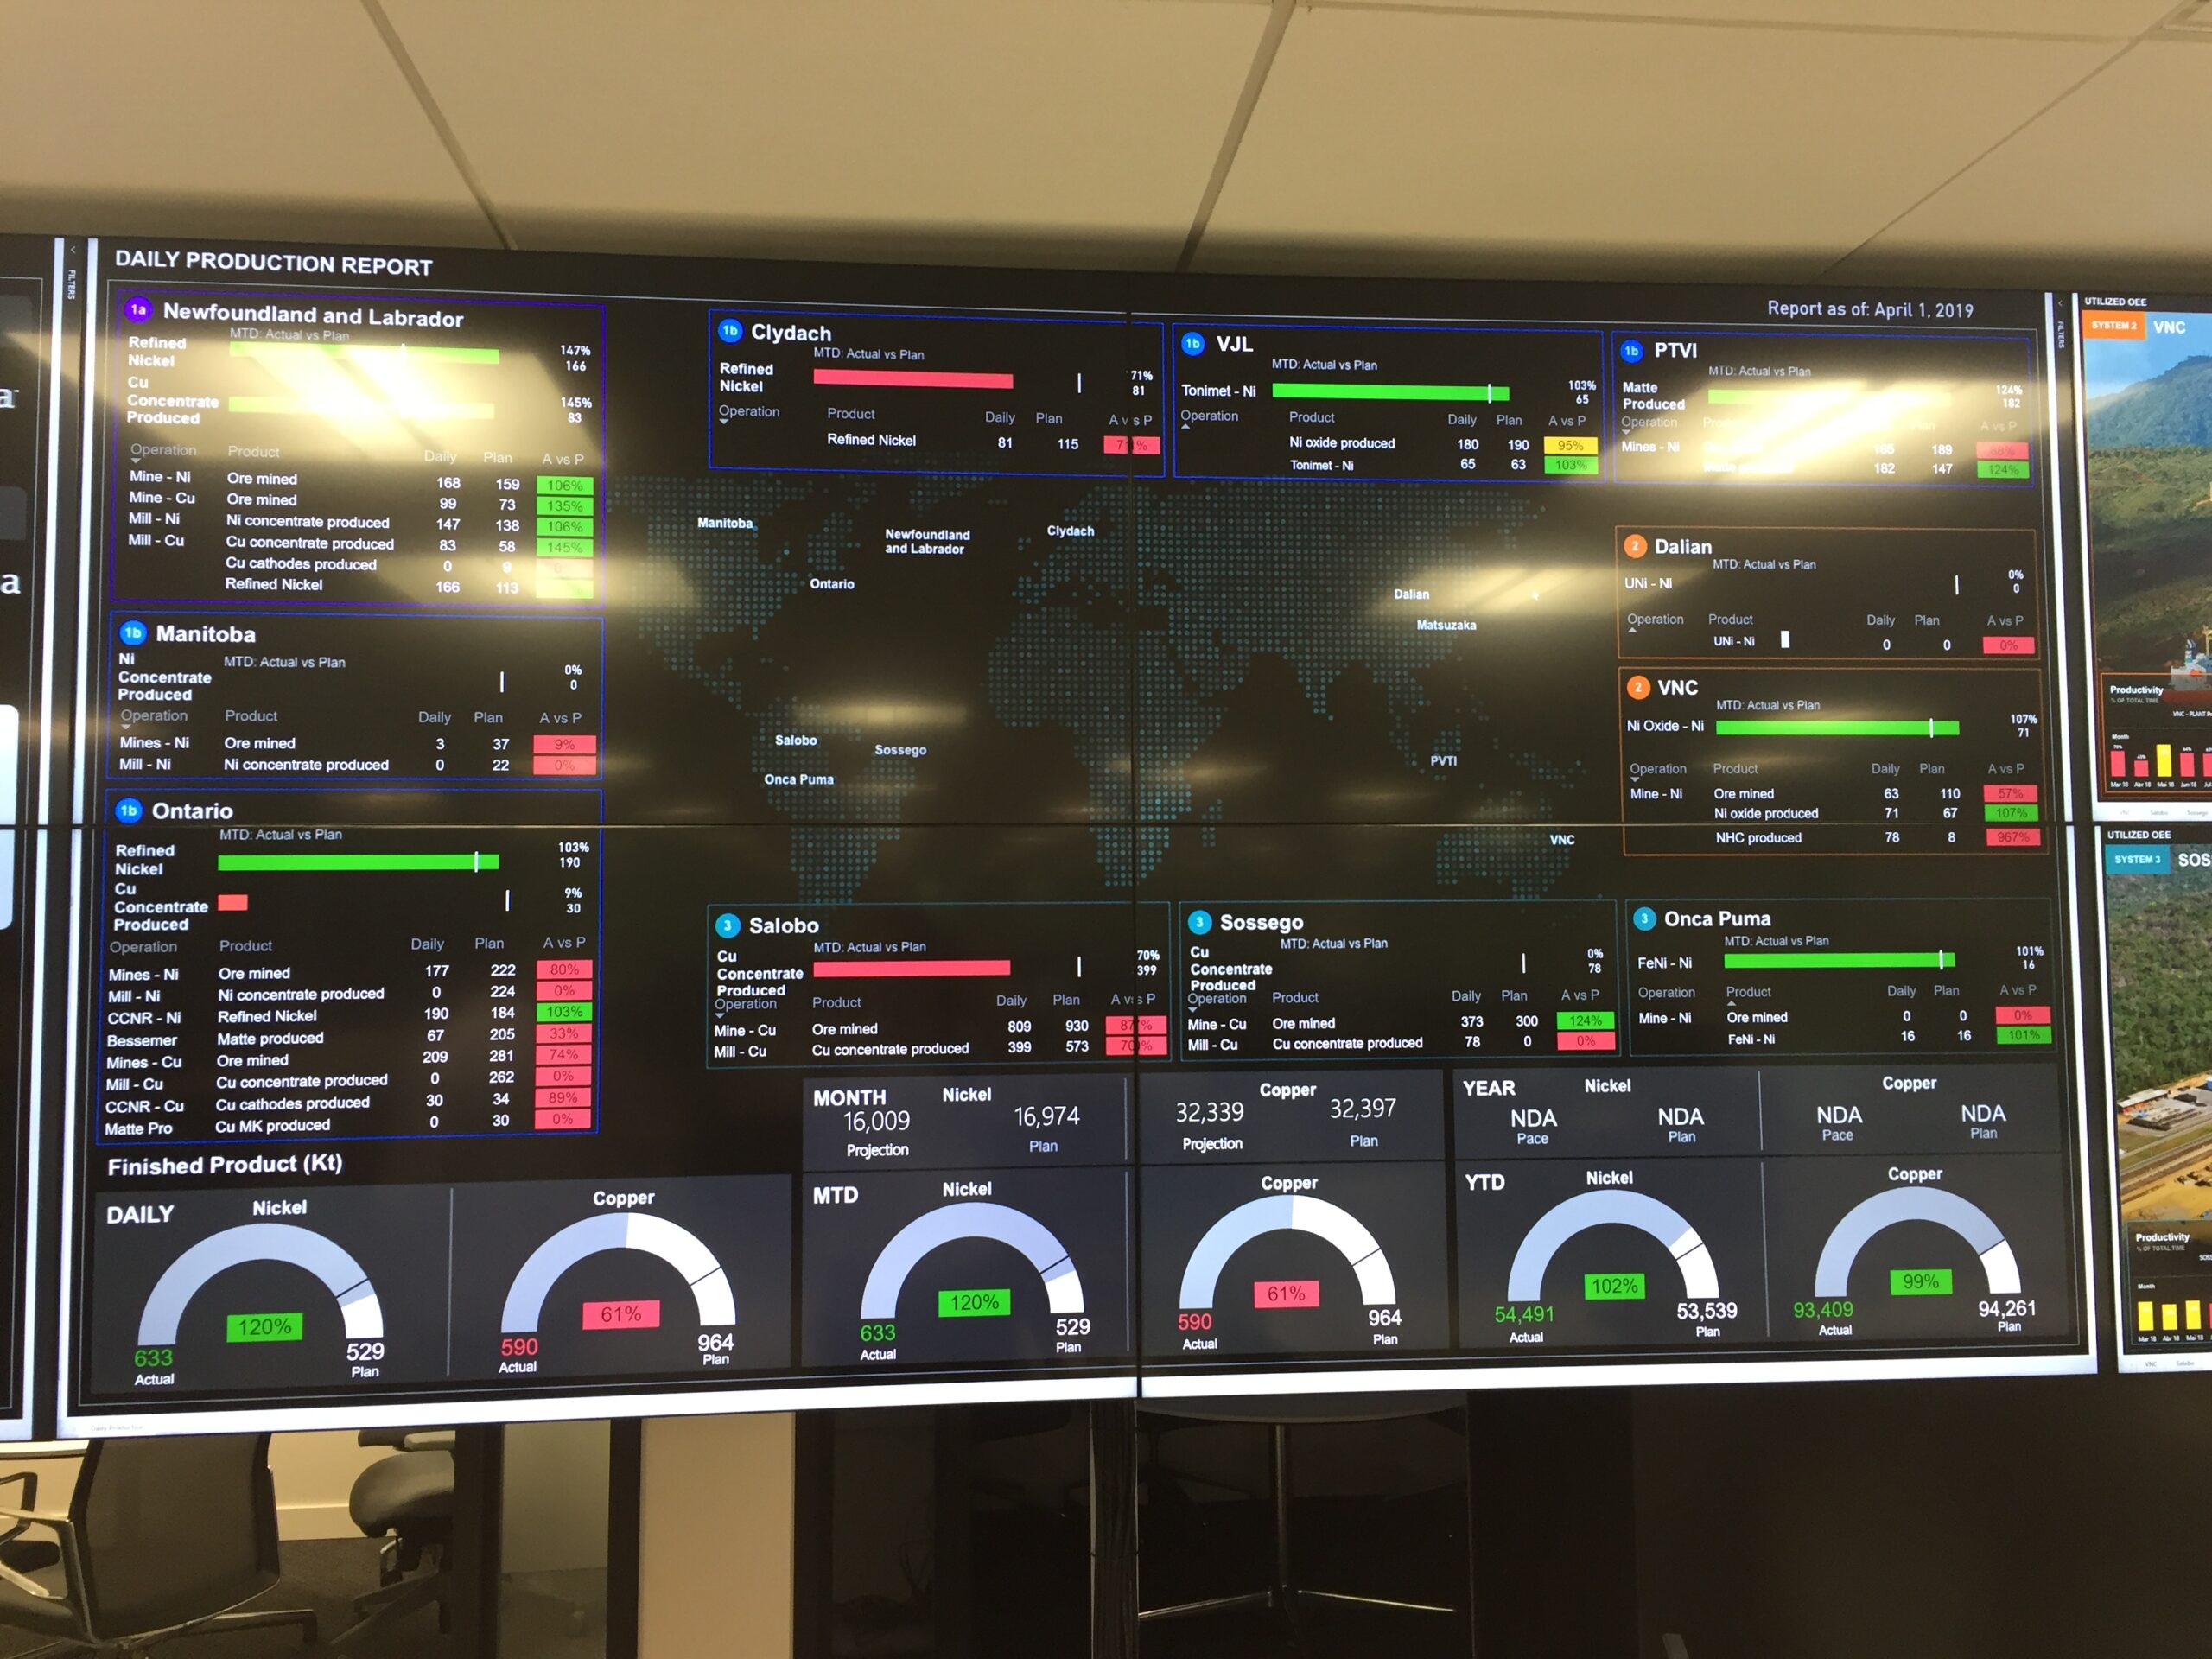
What is the EPM Dashboard?
The Digital transformation team had successfully delivered the Enterprise Performance Dashboard tool. The vision was to implement routine management for North Atlantic across all leadership levels, focused on performance and results. Including KPI management, deviation analysis, and data visualization.
The problem
End users (senior management) were not happy with EPM Dashboard. For over a year the focus was on technical feasibility & business value. Indeed, they had provided a system for measuring and managing the performance of the business, however they were missing how end users desired to interact with the Dashboard.
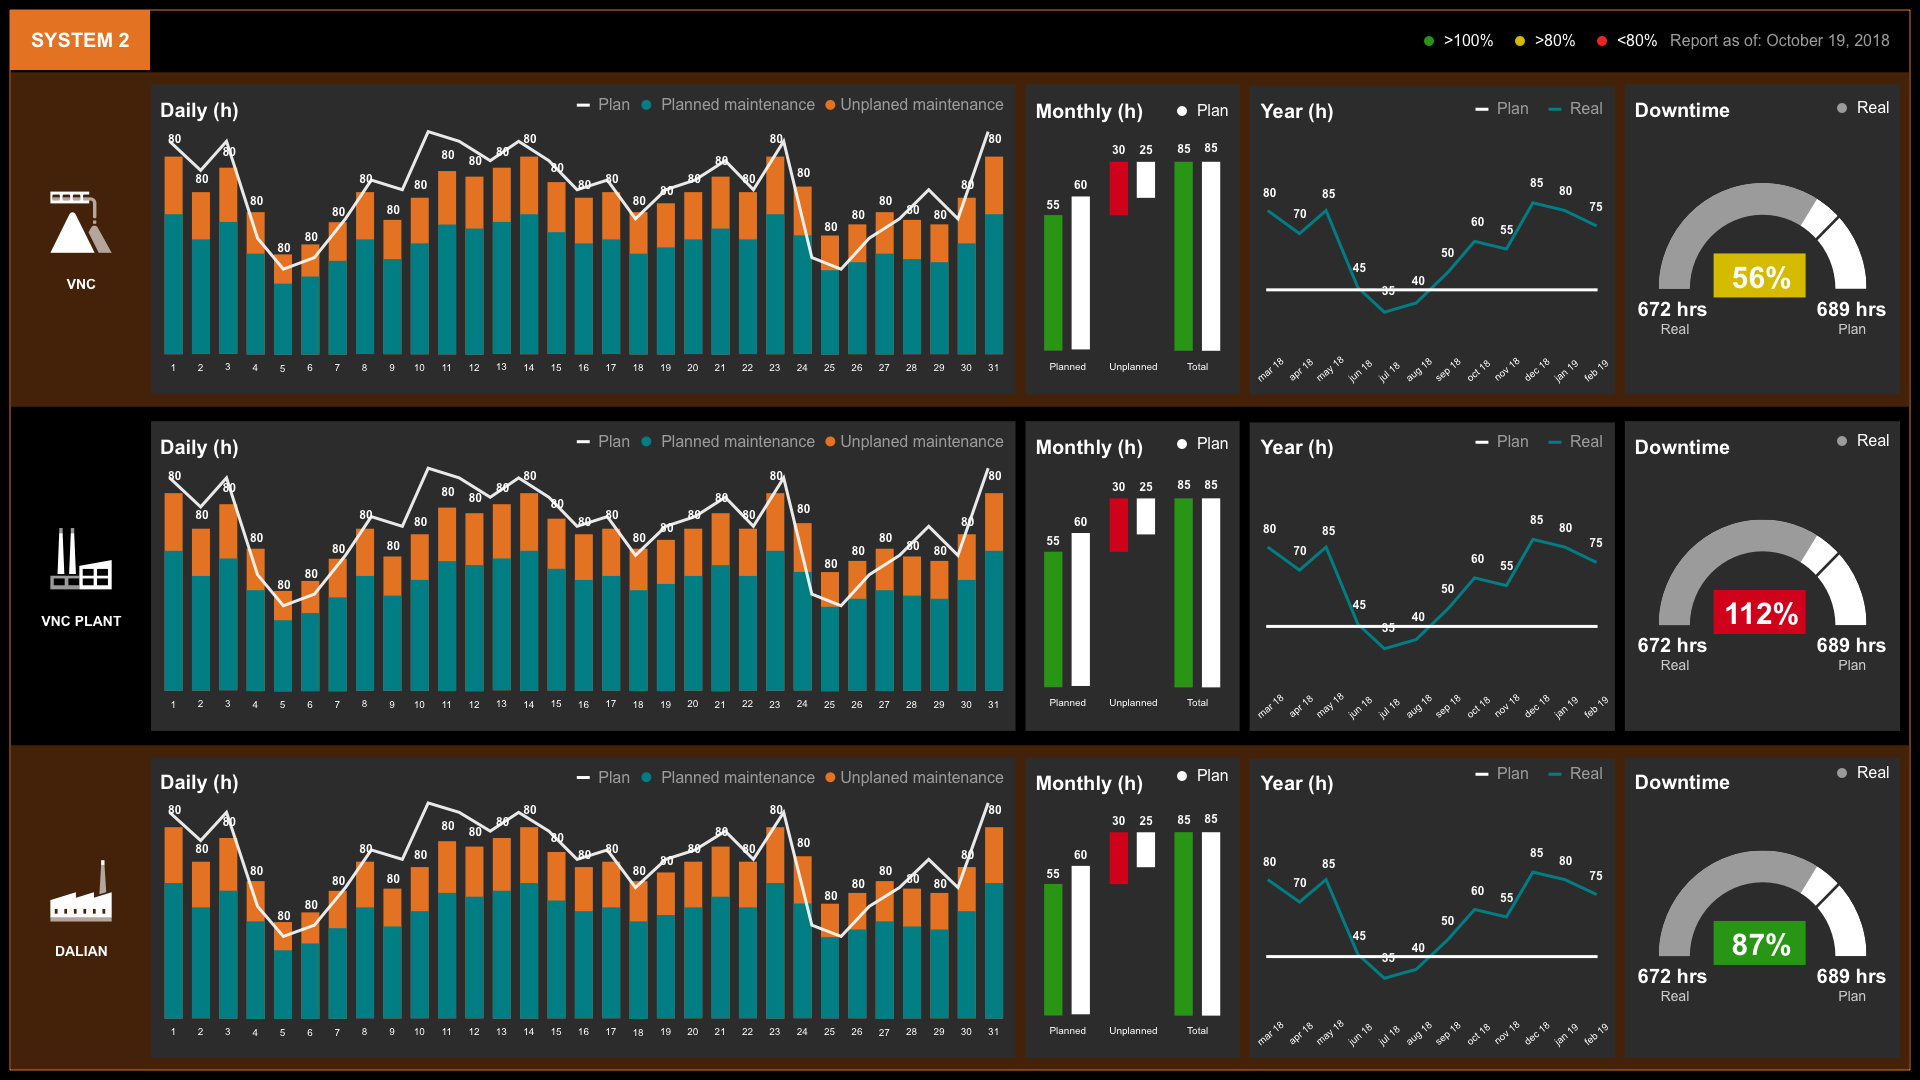
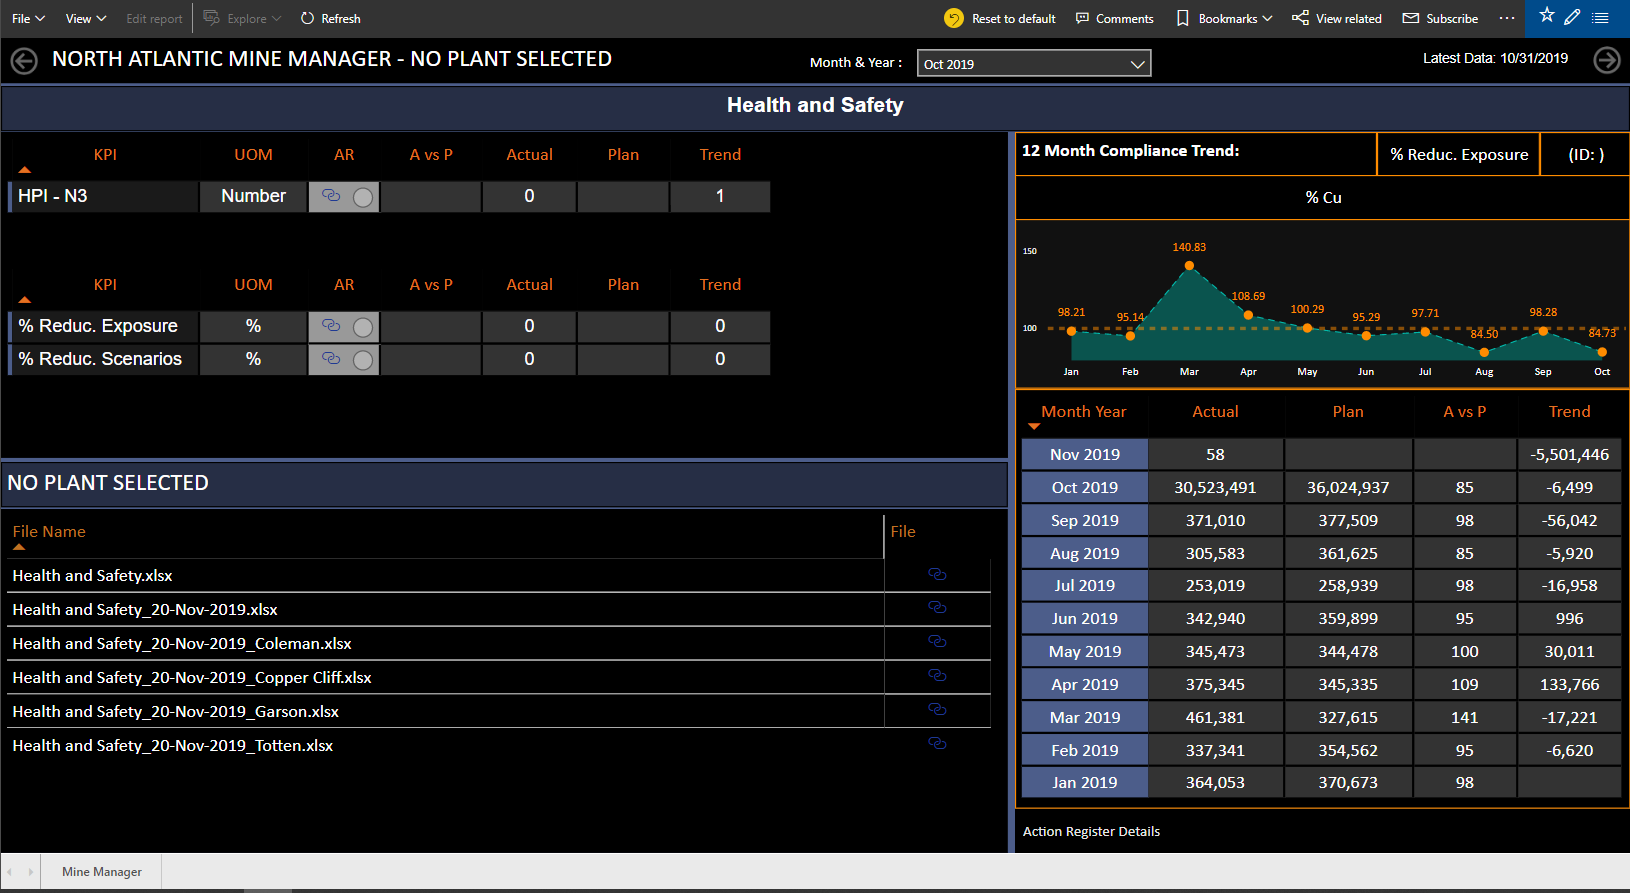
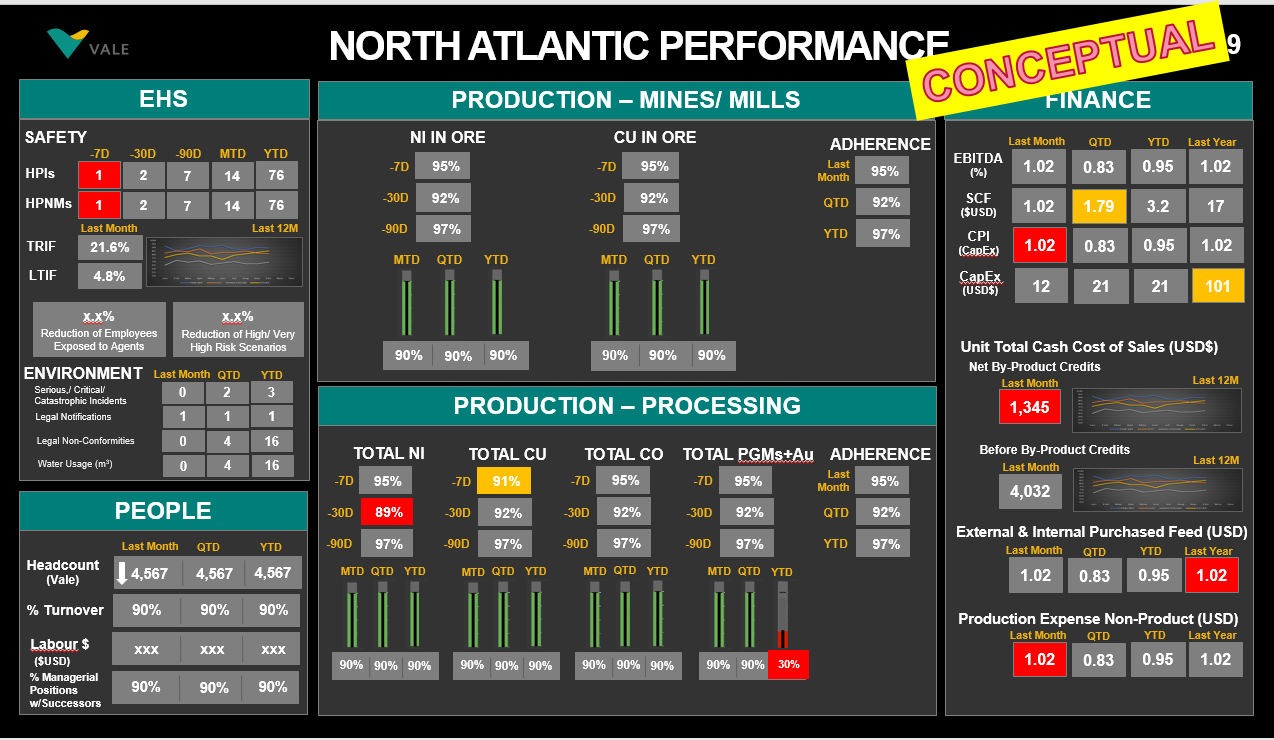
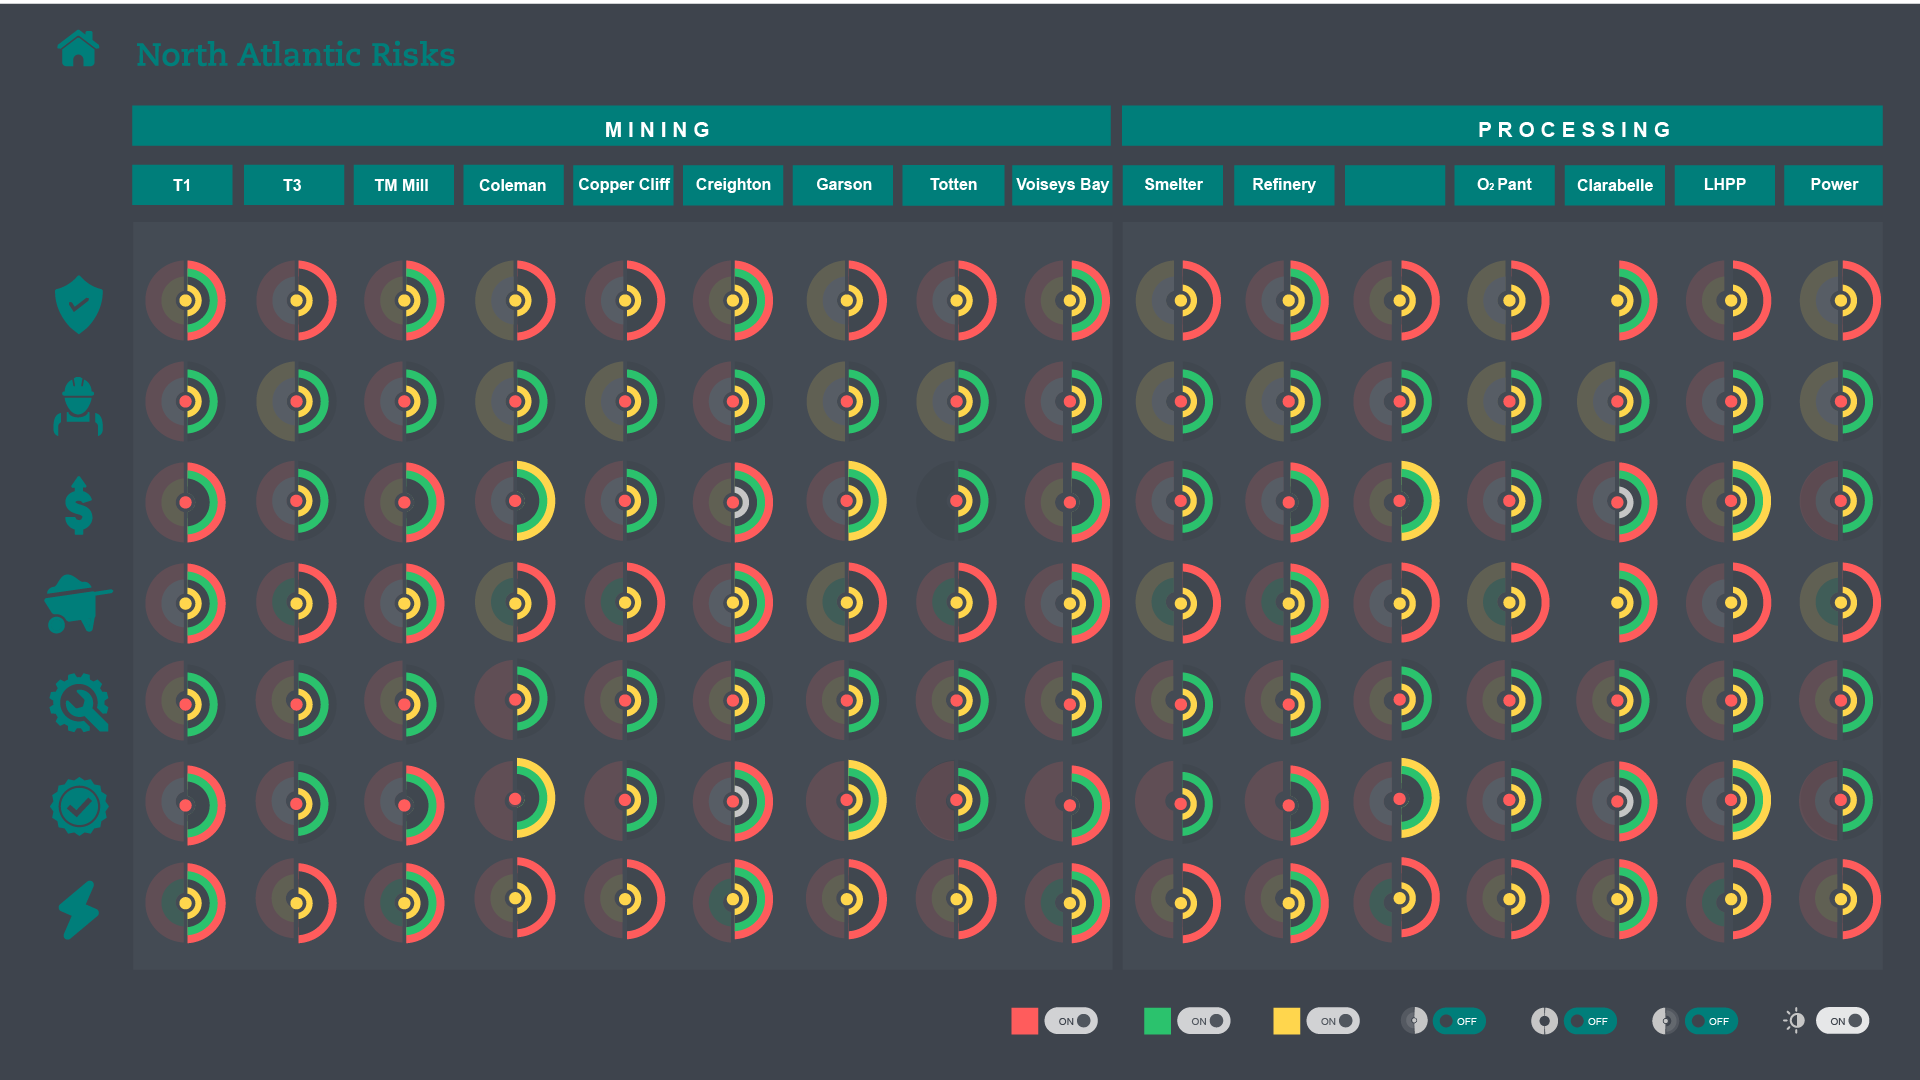
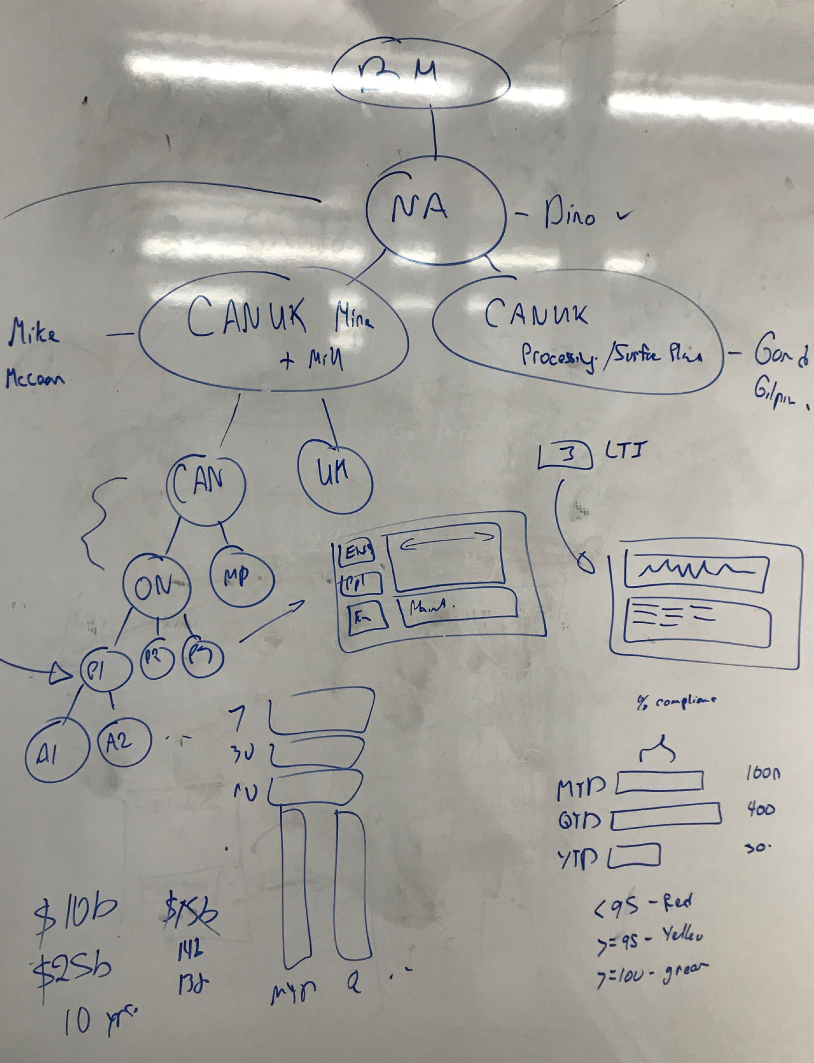
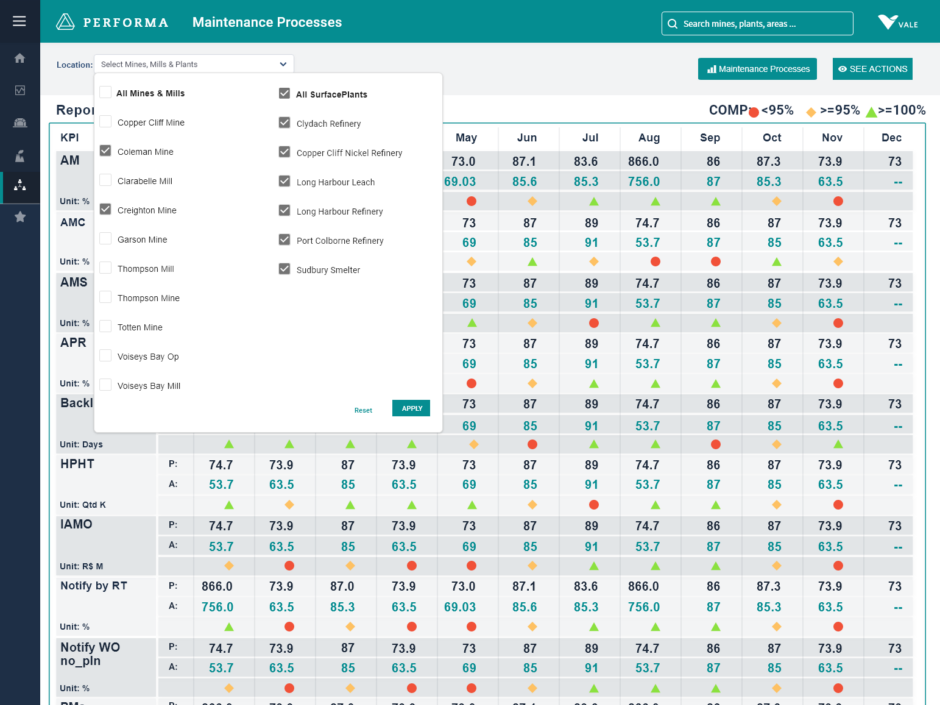
Previous versions of EPM Dashbpoar
Discovery
With a tight deadline of 2 months, I joined the EPM Dashboard Team. Subsequently, gather documentation available, and interview with stakeholders. Observing how COO, upper and middle management drive meetings and analyze data with their teams.
Findings
- Sometimes users want to do deep data analysis, and other times just get “at glance data” to keep tabs on how the business is doing.
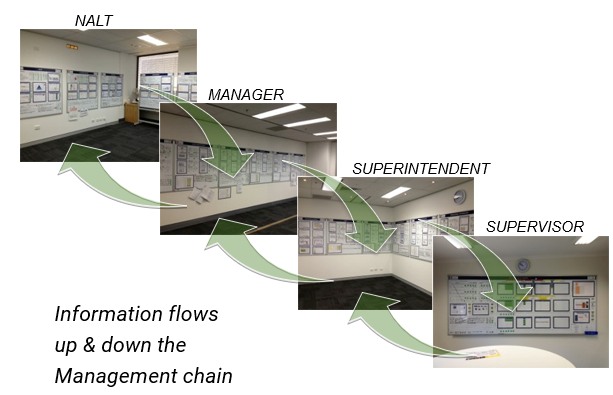
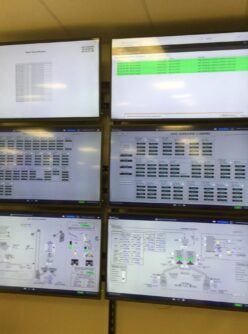
- When reviewing the data users were having difficulties driving the meeting. The environment changed often for the user, sometimes underground, sometimes in the comfort of a bright office depending on the user. Attendees were not able to read data from far away and engage at all.
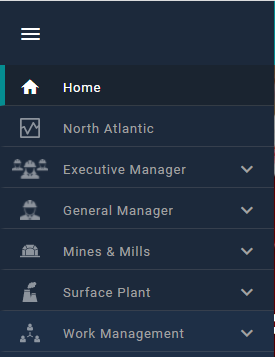
- Dashboard viewers vs desktop users. Individual vs collective use. I discovered other user needs with regard to other tools integrations, allowing me to have a clearer product roadmap.
- PowerBI has limitations like navigation flow in between dashboards (not intuitive) as well as visual interface limitations, accessing reference files. Nothing beats easy nav like HTML.
- Users were confused about product dashboard names “Performance Dashboards”, “EPM”, “VPS Dashboards”, “SAP Hana dashboards”, “KPI Dashboards”, “PowerBI.
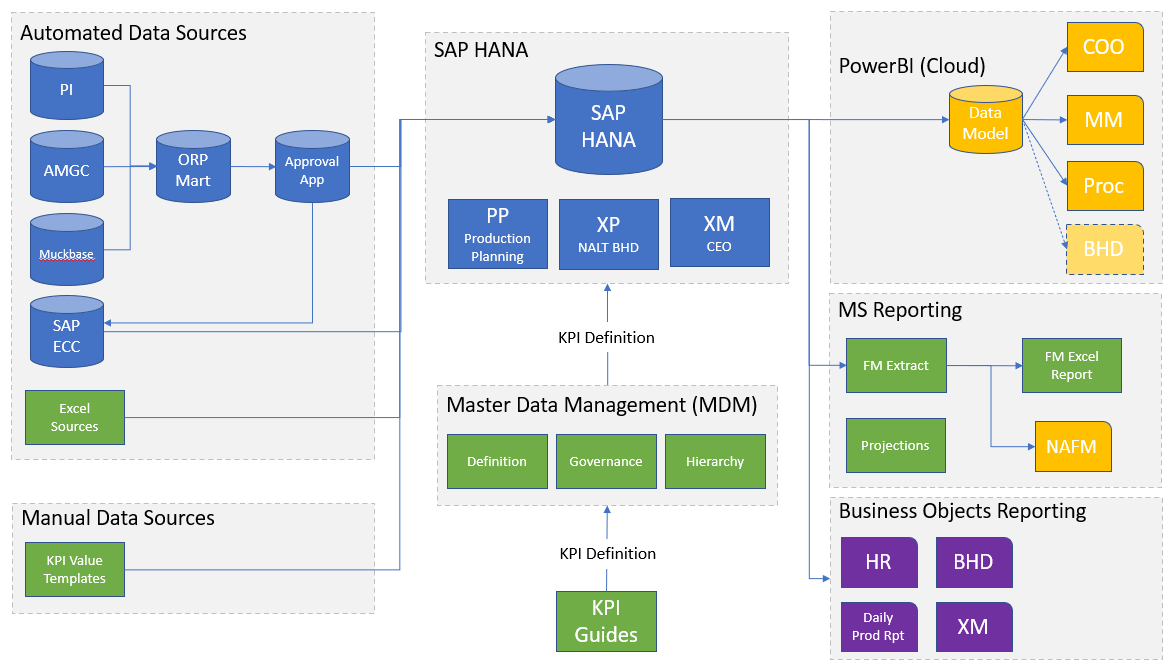
Definition –
Hypothesis
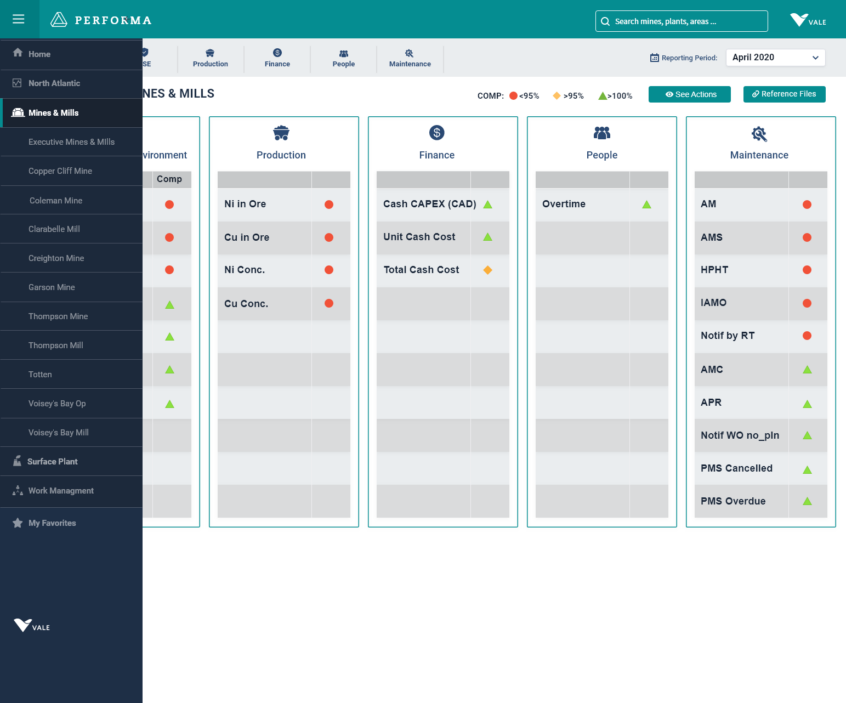
Easy to consume data dashboard for measuring and managing the performance of the business from the superintendent to COO level; all supported by a centralized repository of business metrics.

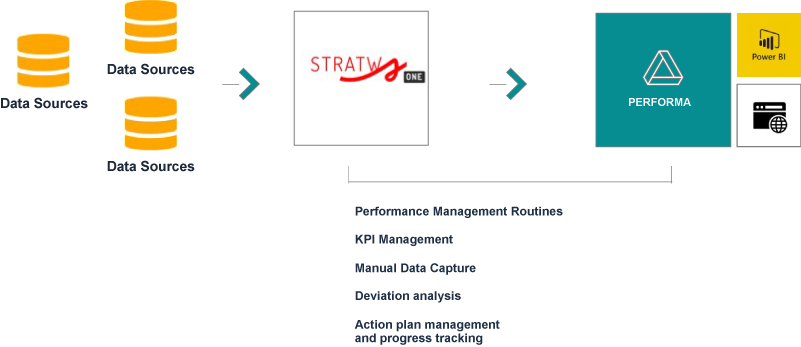
I documented and defined the different personas and specific needs. Performed a heuristic analysis in the dashboard. Shortly with the team, we proposed a new architecture with a hybrid framework of Angular and PowerBI in the front end.
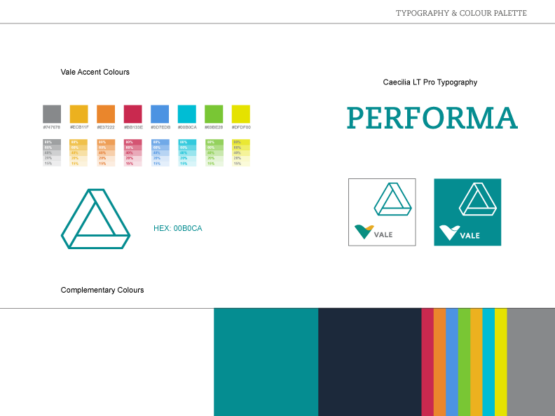
Simultaneously, I facilitated sessions with stakeholders to create a name brand for the product so everyone could engage and adopt the new name.
The name was appealing to Portuguese, English and French speakers .
I designed the logo , brand guidelines and UI guidelines for the interface.
Ideate, Prototype &Test –
The tight deadline was a concern, however, in parallel, I had been working on field research to understand underground personas. As well as I had been working close to management in other projects. This gave me the leverage to have better context in such a limited time. I decided the best approach was to build and test high-definition prototypes in XD. With the focus on improving usability, navigation, readability for all personas.
I validated prototypes with the dev PowerBI team and Full-stack team (ensuring that it was feasible. I moderated usability testing with business (ensuring that it was valuable).
Integration was a major challenge, to continuously discover tech limitations while iterating, finding solutions together with development teams and business stakeholders. Leadership users were not always available for testing, meetings.
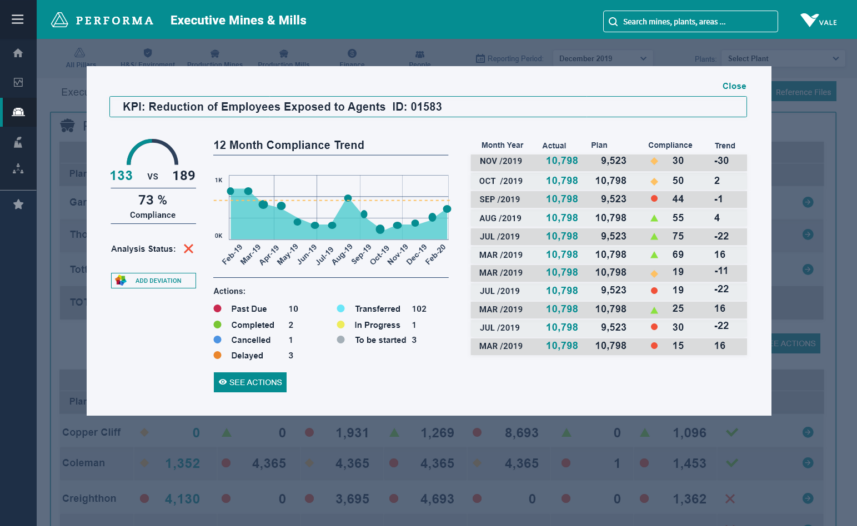
Implement-
With such a short time frame, I supported the team by overseeing implementation to refine the product, testing and launch of the tool.
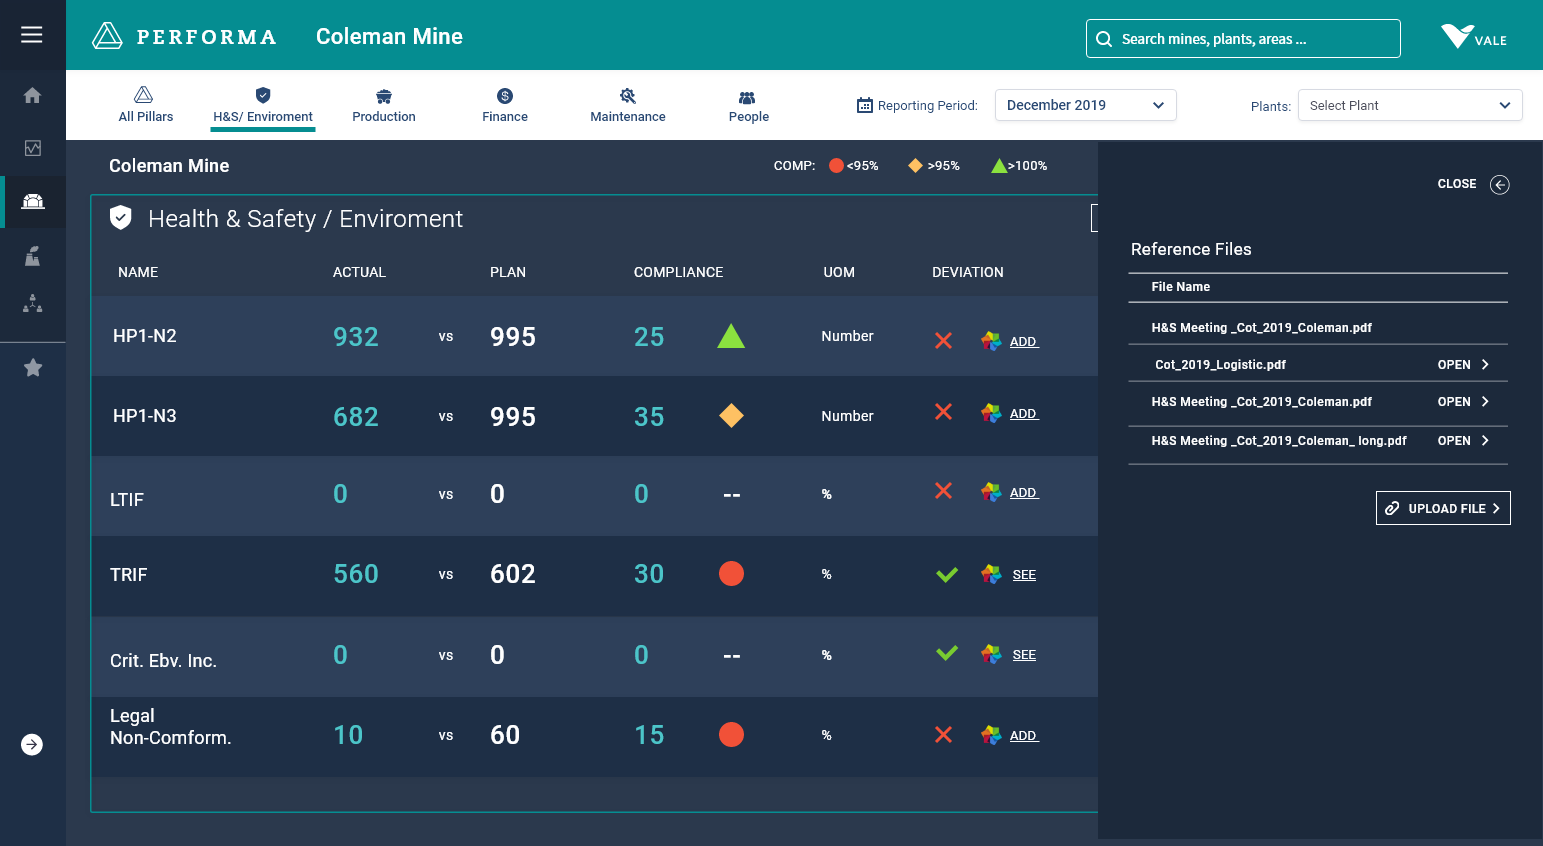
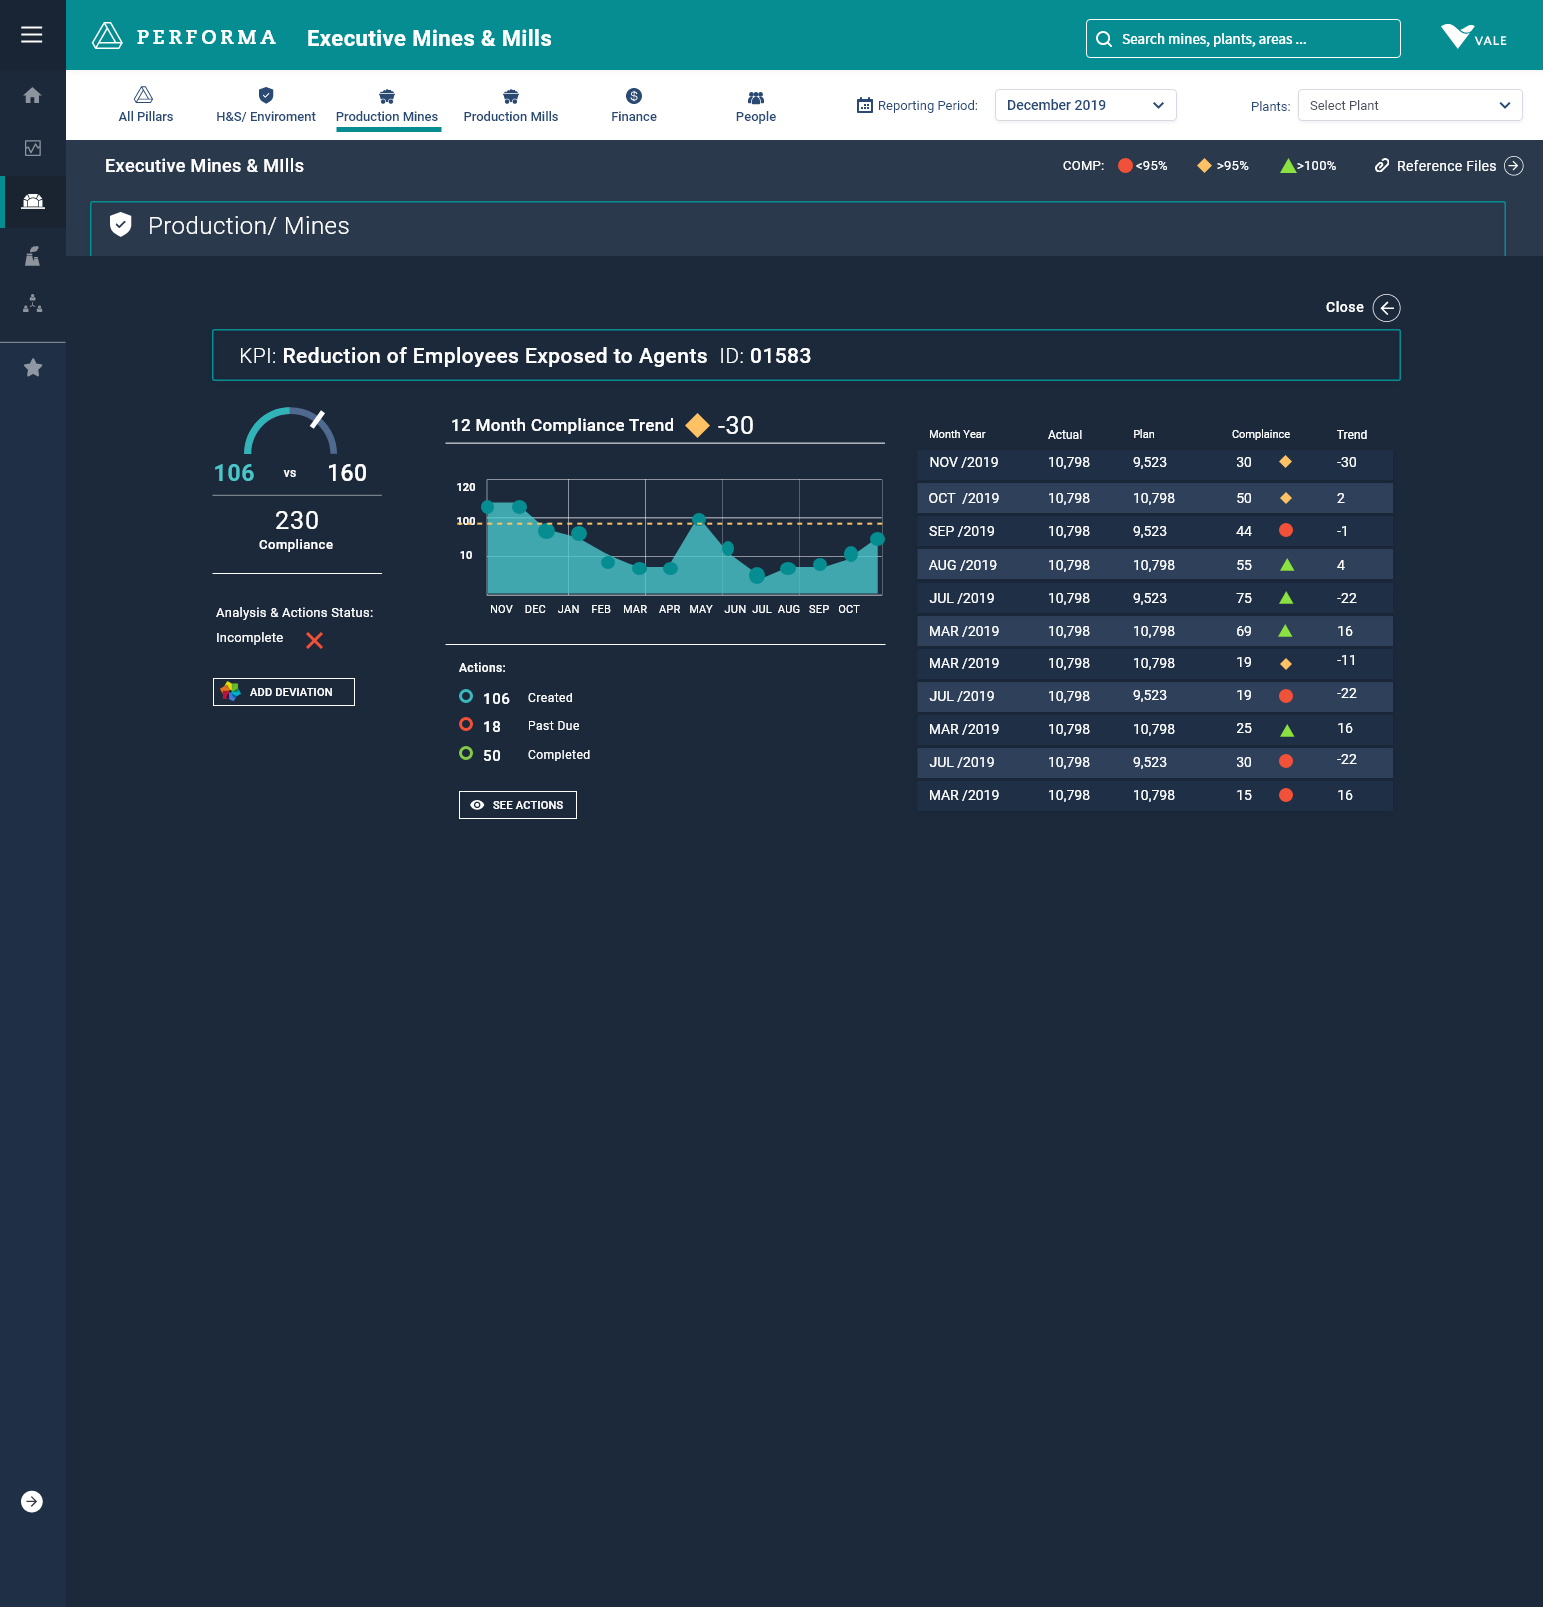
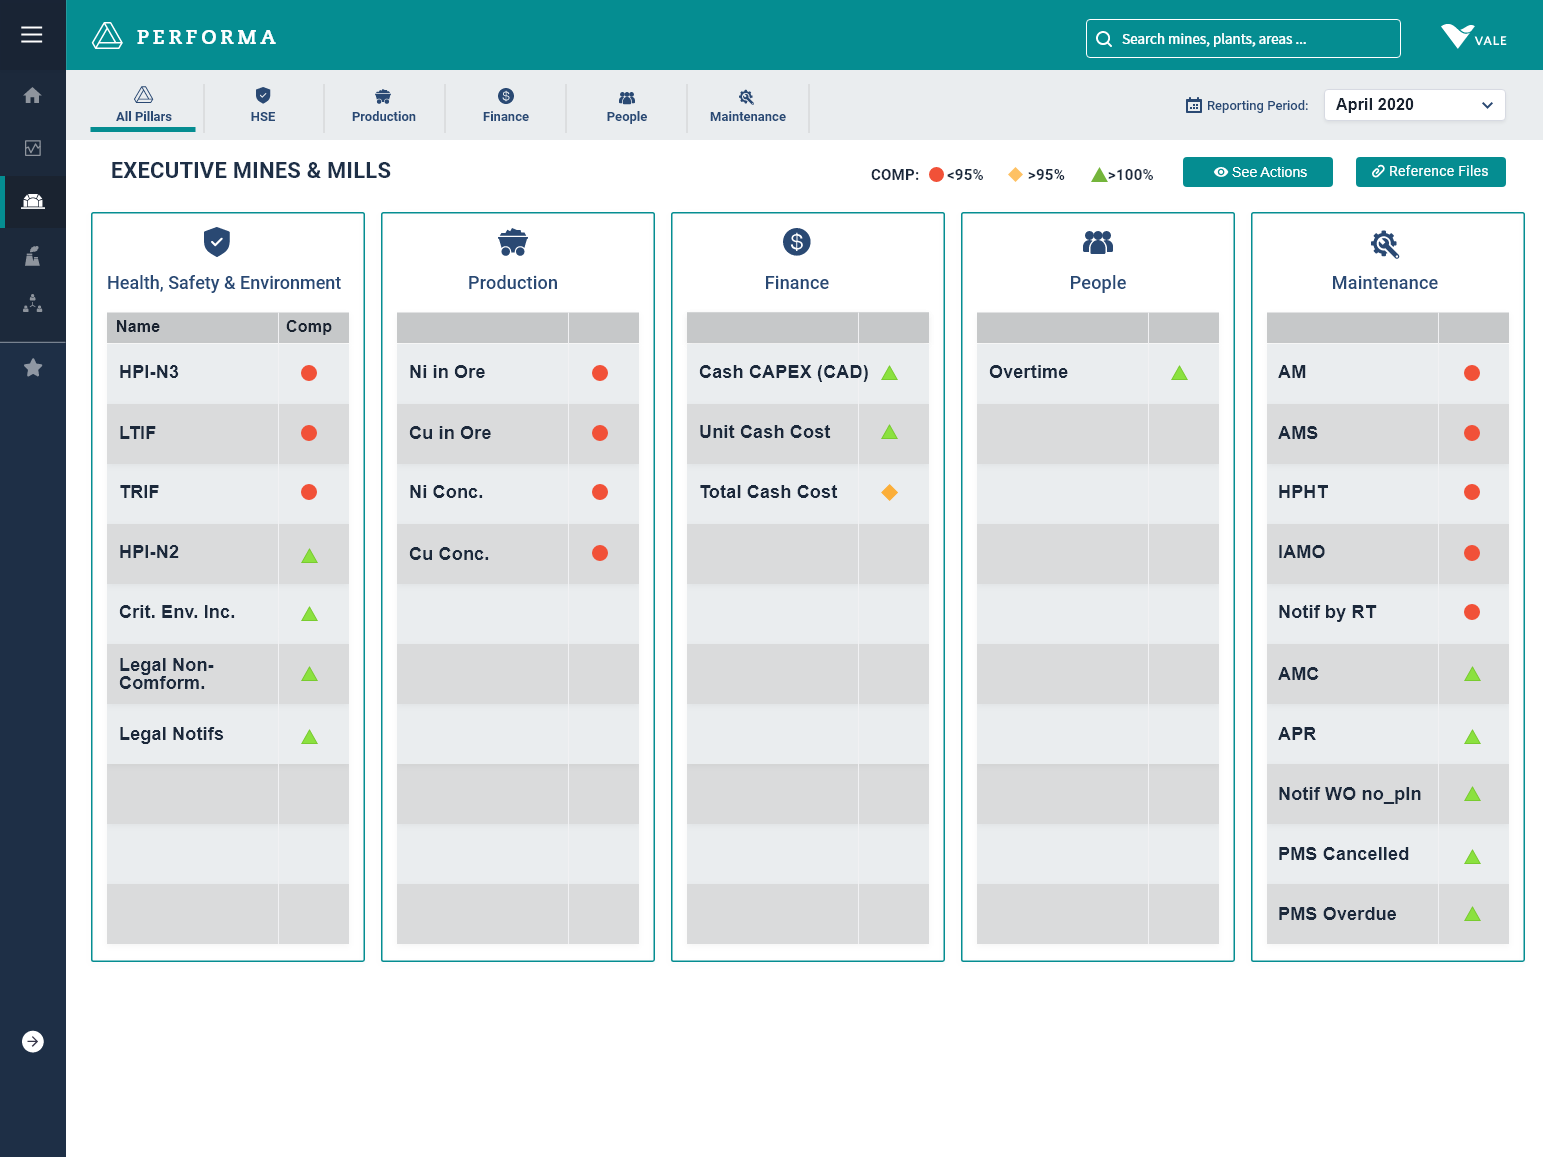
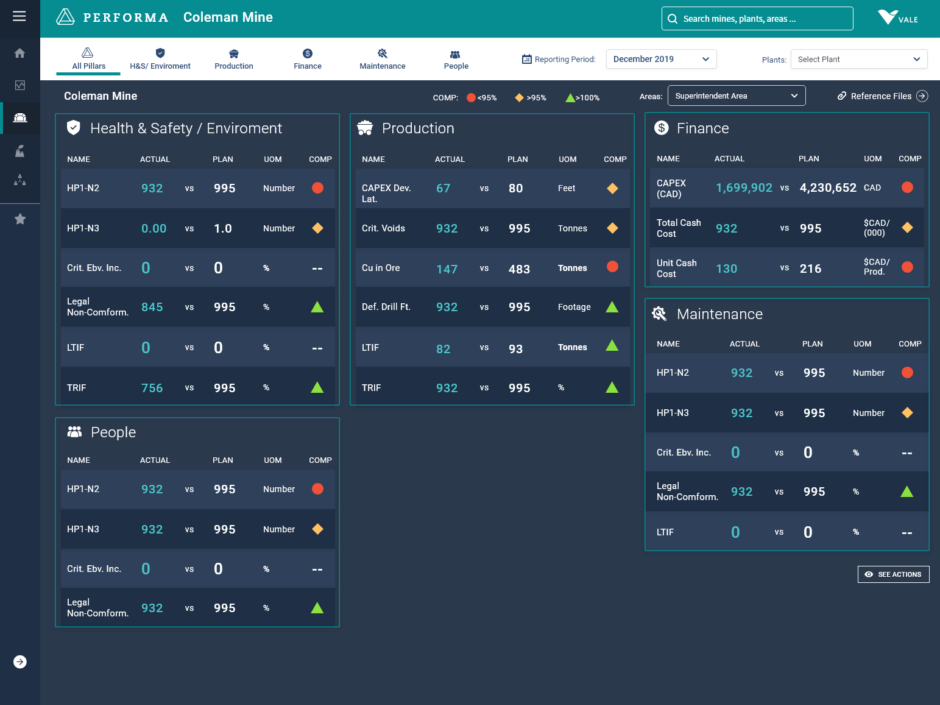
Performa was able to facilitate leadership implementation of routine management, and addressed all pain points mentioned above.
For middle management levels and down, Superintendents and Supervisors there is more user research to understand how they consume the data.
Check out the product demo